How our understanding of data center complexity helped reinvent its management software
CLIENT
HP Enterprise
LENGTH
2011 – 2012
CONSULTANCY
Smart Design
MY ROLE
Team Lead
THE CHALLENGE
HP’s legacy server software couldn’t meet the needs of today’s data center administrators.
From the onset of the program, we identified four areas to address with the redesign.

More with Less
Exponential growth of data storage is outpacing technical and human resources

Flexible Relationships
Legacy tree architecture is inefficient when dealing with complex object relationships

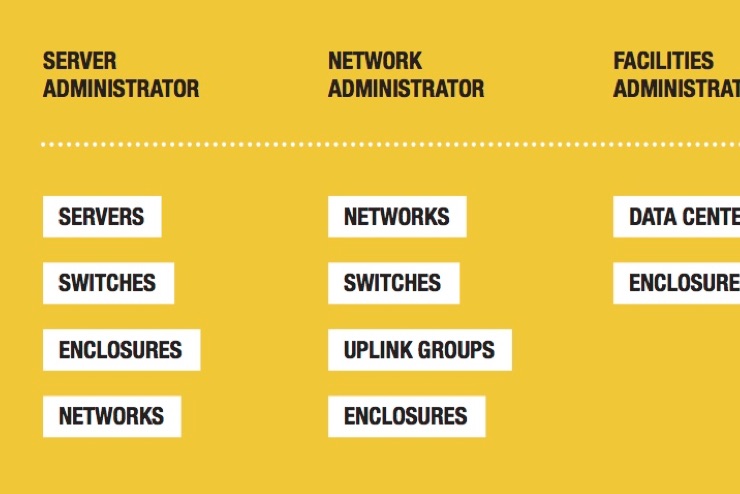
Overlapping Roles
Different types of administrators work side-by-side as they configure and troubleshoot

Consumerization
Users expect software at work to be just as easy, enjoyable and polished as mobile apps
OUR TEAM
Program director
Team lead – me
Interaction designers
Research and visual
design support
MY ROLE
Interaction design
User research
Product strategy
RESEARCH
Before brainstorming, we first had to internalize data center constructs and workflows.
In-person interviews with experts revealed opportunities for improvement across roles.
We synthesized our observations into design-actionable insights and frameworks.
We also created countless architectural options, feature concepts, and scenario flows.
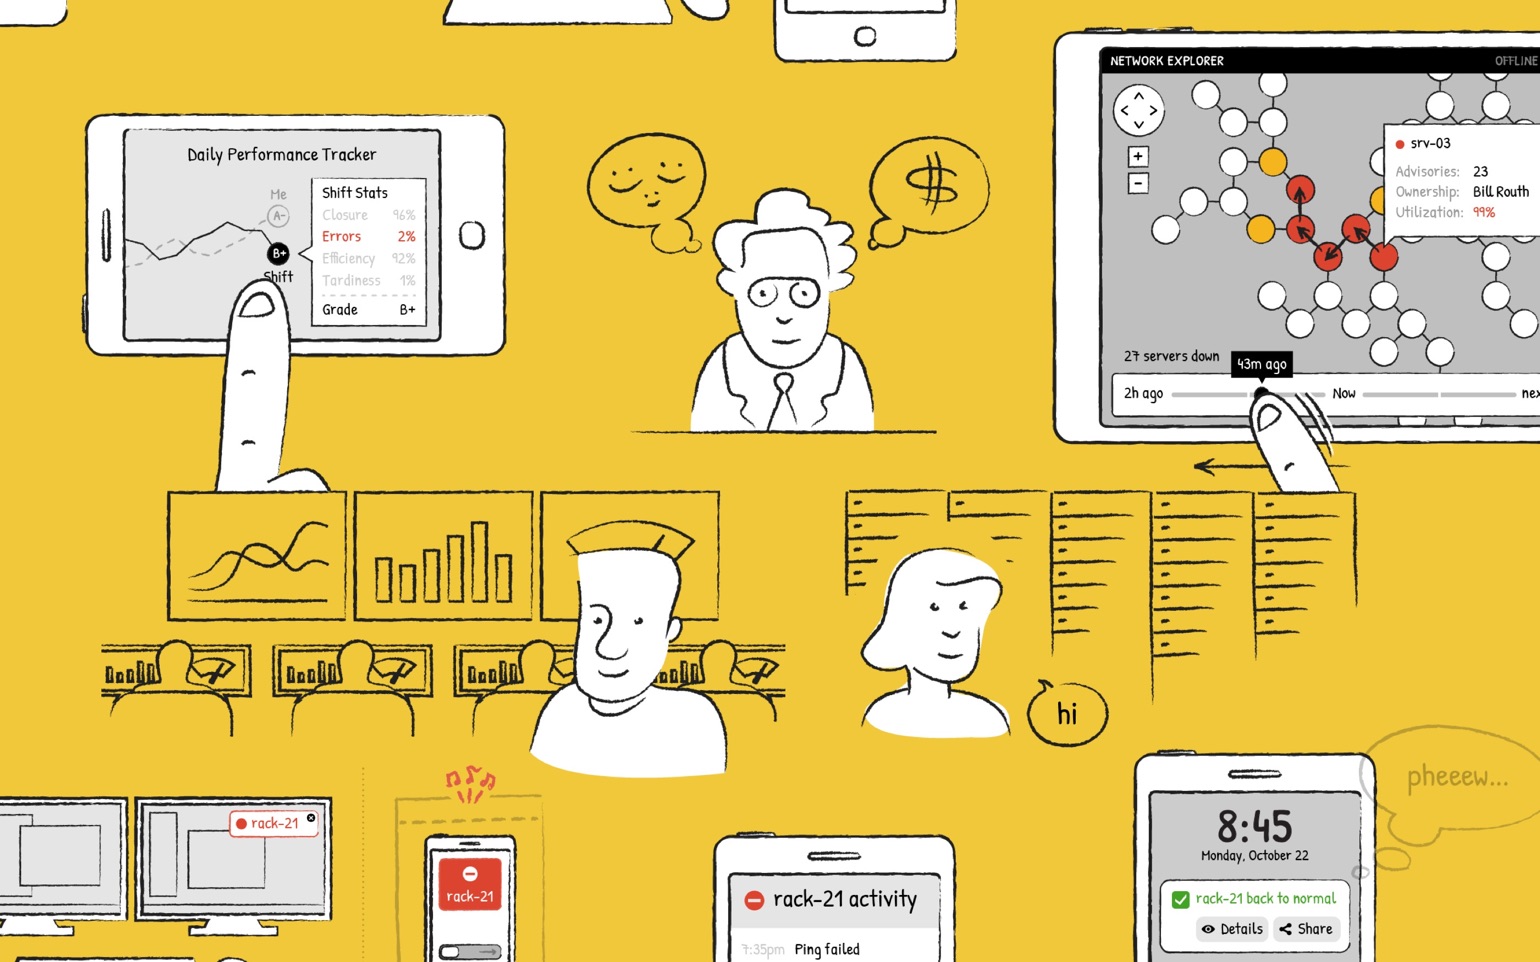
To contextualize the proposed interface and feature concepts, I illustrated key scenarios for each of the main administrator archetypes.
DESIGN
As we transitioned into design, we piloted an iterative process later adopted by HP teams.
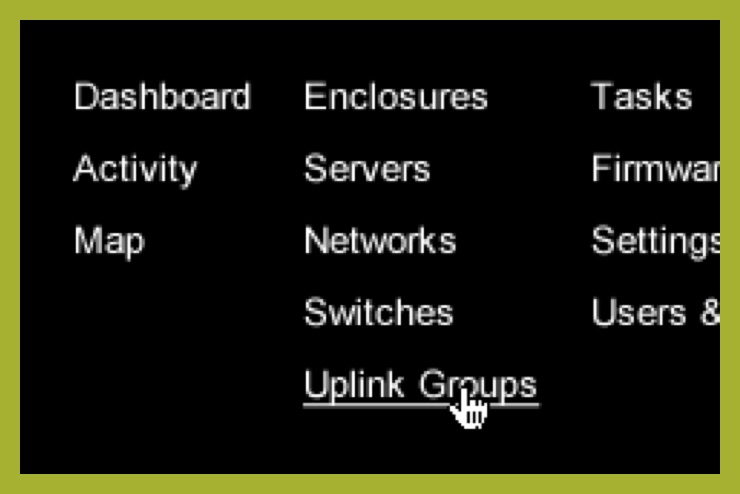
We explored a variety of taxonomies as part of architecting the application.
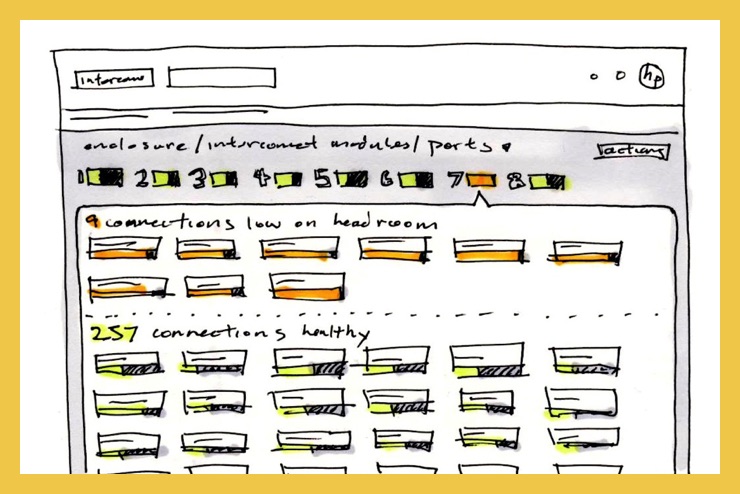
Wireframing was done in low fidelity, allowing us to cover a lot of ground quickly.
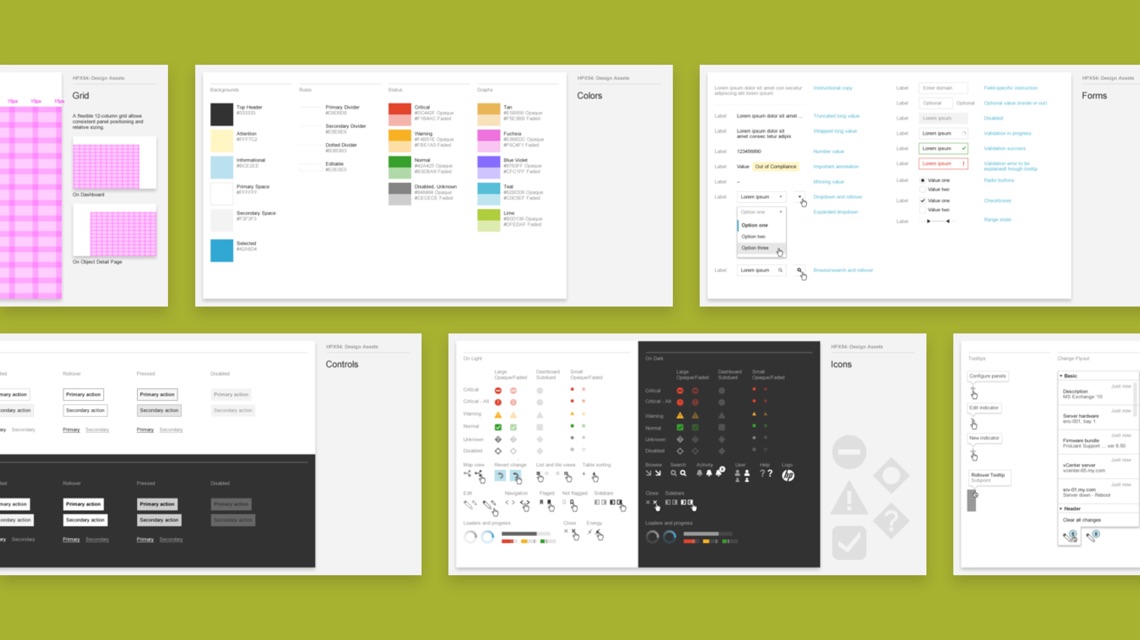
Interface style guide included many different types of components.
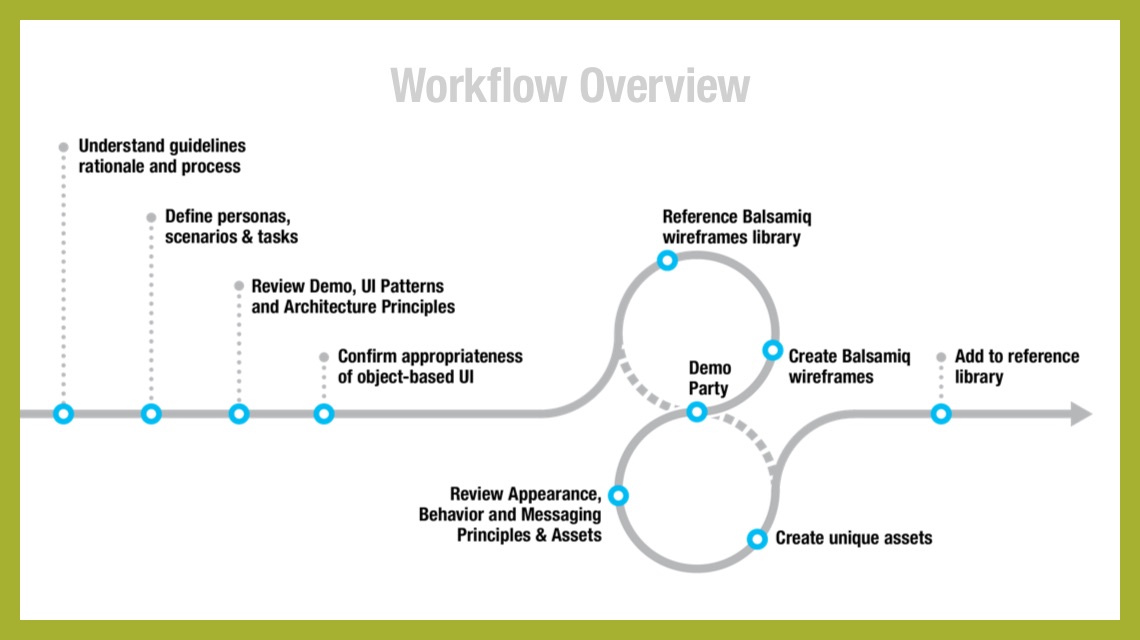
Our product design workflow was adopted by several HP teams.
IN SUMMARY
Our ongoing collaboration with end users and HP engineers was essential to the outcome.
In 2013, the application was released as “OneView”. To accompany the product launch, HP created a video to explain the user-driven design process.
FIELD NOTES
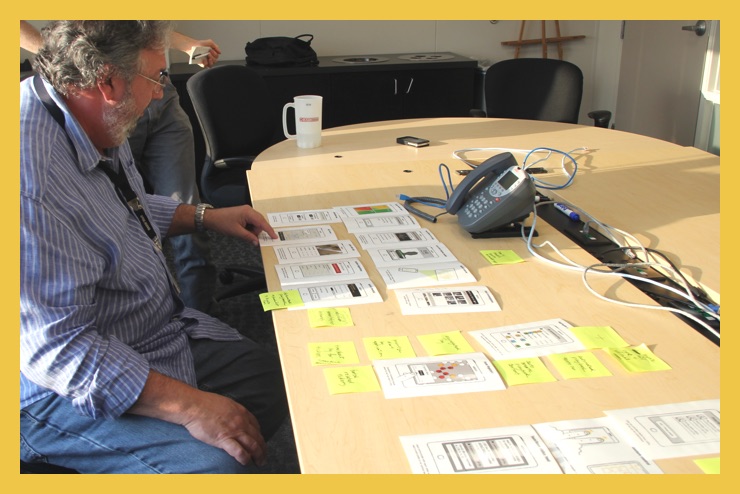
One of the highlights was our research trip to HP’s data center facility in Houston, pictured here. An enormous operation with its own power substation, it’s required to be up and running 99.995% of the time.
As we conducted workshops with system administrators of different specializations and levels, we gained valuable insights into their priorities, frustrations, and ideas.
INNOVATION
We invented two approaches to visual troubleshooting.
Map view contextualizes a selected object in relation to its parent and child objects. This tool helps the administrator quickly navigate up or down the technology stack to locate the root of a malfunction. The view automatically arranges objects for optimal visibility, whether it’s just two servers or two thousand.
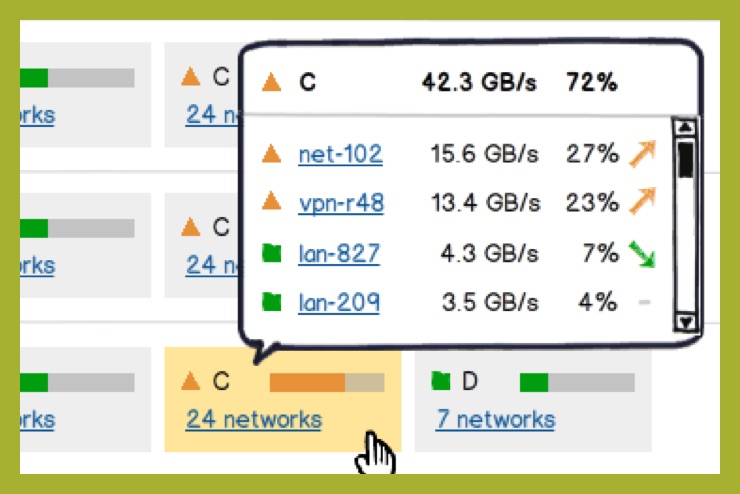
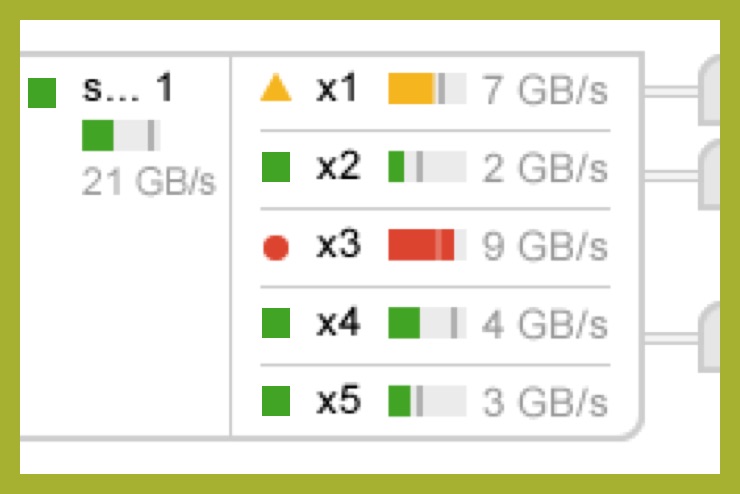
To explore the entirety of infrastructure, system administrators can use the Visualizer view. Designed to handle large numbers, it groups objects by type, displays their status, and allows cross-linking. Once an object of interest is found, its details are just a click away.
RESULTS
42% lower total cost of ownership and a 220% return on investment
Based on a scenario of 320 HP ProLiant BladeSystem servers and OneView over three years versus traditional management tools
“Helped reduce a technology rollout from 66 days to one day. It’s the breakthrough we’ve been looking for.”
Large financial services institution with 250,000 users and an HP beta customer
“Refreshingly simple consumer-style dashboards, powerful natural language alerts and search, and robust topological visualization.”
IDC, 2014
More by me.